Building a Durable Telemetry Ingestion Pipeline with Rust and NATS JetStream
Why Direct-to-Database Ingestion Fails at Scale and What Actually Works
Ingestion pipelines are often simple to begin with: a device sends a location and an API writes to a database. This approach works until it doesn’t. When you’re ingesting thousands of GPS updates per second from trackers across multiple tenants, that direct-to-database approach becomes your bottleneck and your single point of failure.
The symptoms are always the same: timeouts spike during traffic bursts, the database chokes on concurrent writes, and you start losing data when things get busy. Then someone suggests adding caching, or connection pooling, or sharding. You’re treating symptoms while the fundamental design is broken.
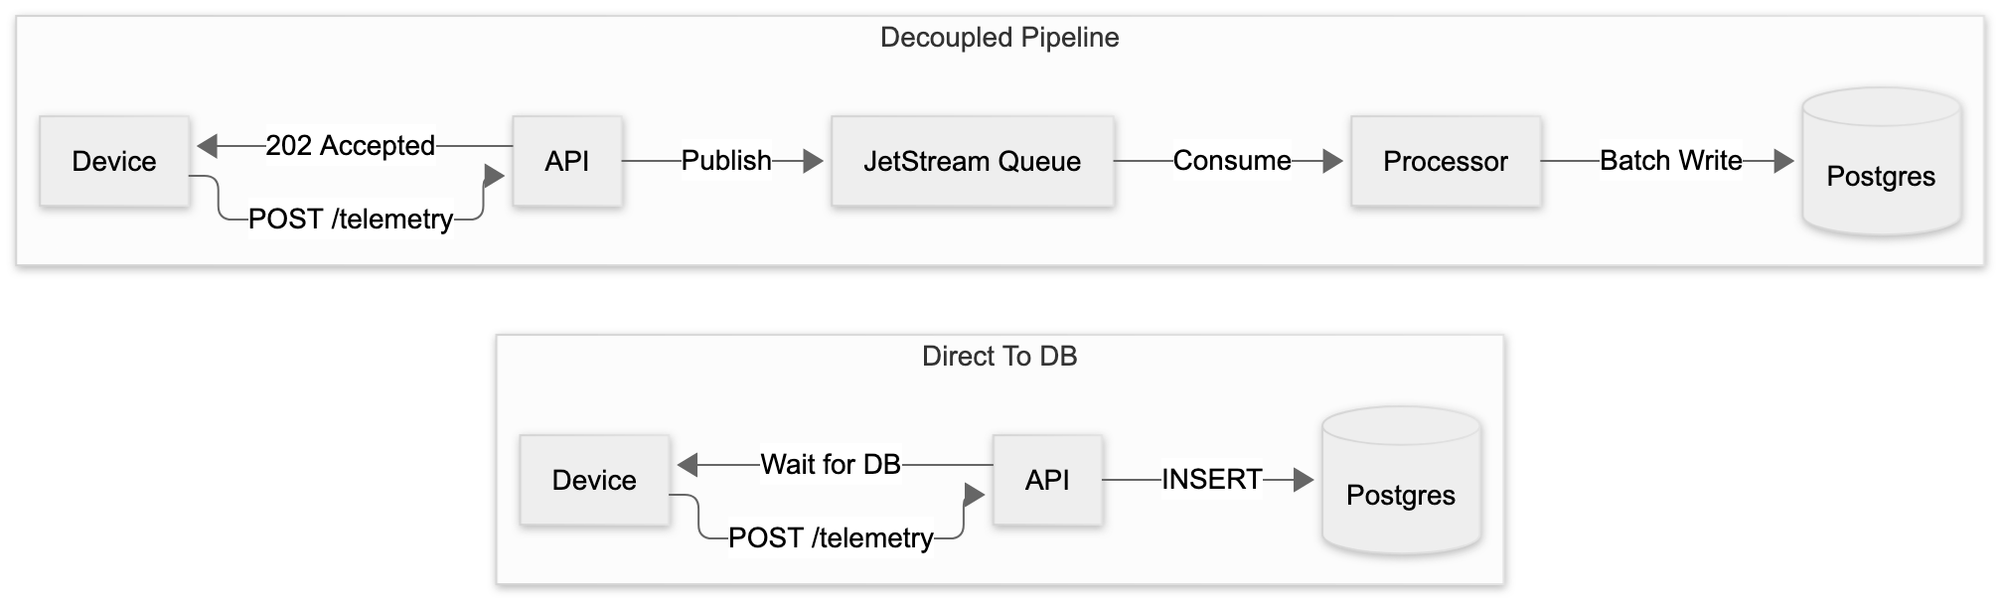
The real problem is coupling. When your ingestion API writes directly to Postgres, every device update has to wait for a transaction to complete. Your API response time is now tied to database performance. If the DB hiccups, your ingestion fails. If you need to run a heavy query, it impacts ingest throughput. You’ve made your fast data intake depend on your slow data storage.
Why We Decoupled Ingestion from Storage
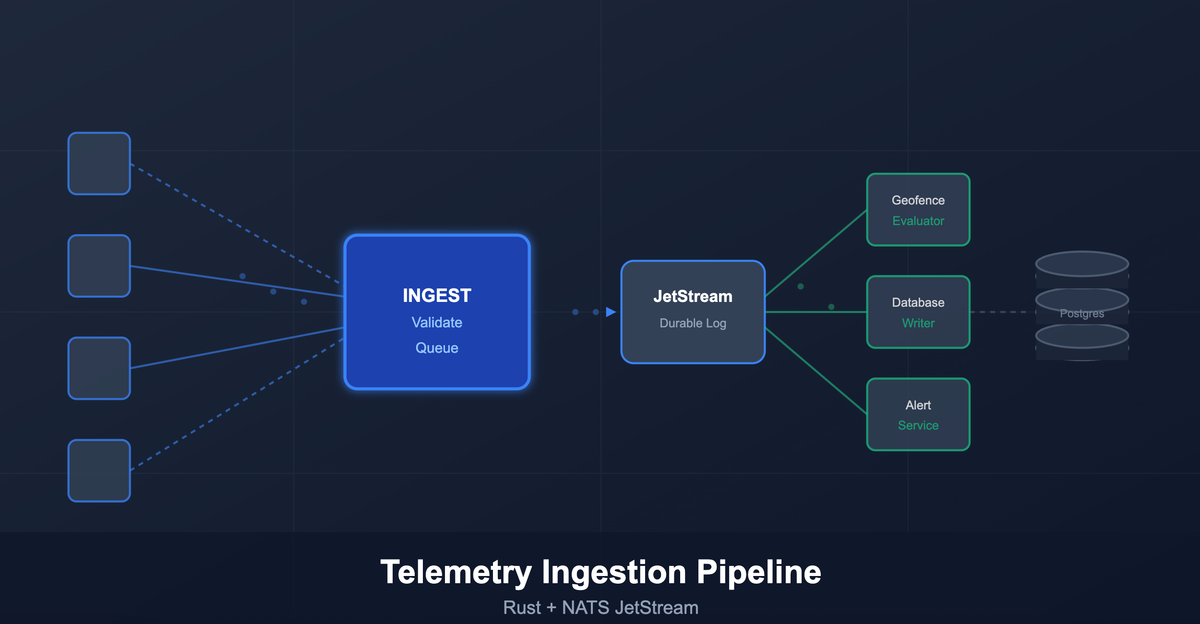
We designed a separate ingestion pipeline specifically to break that coupling. Devices send telemetry to a stateless Rust service that does one thing well: validate the data and get it into a durable queue. That’s it. No database writes, no complex processing, just capture and queue.
The service authenticates requests, validates the payload, and publishes events to NATS JetStream. Once the event is safely in the queue, we return HTTP 202 Accepted. The device is free to go about its business. Everything else – writing to Postgres, evaluating geofences, triggering alerts – happens asynchronously by downstream consumers.
This gives us a shock absorber. When devices send a burst of updates, JetStream buffers them. When the database is under maintenance, data keeps flowing into the queue. When we need to add new processing logic, we add another consumer without touching the ingestion path.
The alternative would be handling backpressure at the API layer, implementing complex retry logic in every device, and watching your database struggle under write load. I’ve seen production systems grind to a halt because someone decided ingestion should be “simple” and wrote straight to the database.
How the Pipeline Actually Works
A device posts telemetry to /api/v1/telemetry. The Rust service validates each record – checking required fields, normalizing timestamps to UTC, rounding coordinates to seven decimal places. Invalid records get rejected immediately with specific errors. We don’t try to save garbage.
For each valid record, we generate a deterministic event ID using UUIDv5. We hash the tenant ID, asset ID, timestamp, and normalized coordinates together. This means the same telemetry data always produces the same event ID, which becomes crucial for idempotency later.
The service then publishes each event to JetStream with a subject like:
telemetry.v1.{tenant}.{assetHash}We sanitize tenant identifiers and hash asset IDs to keep subject names consistent. JetStream writes the event to disk and acknowledges receipt. Only then do we consider the ingestion successful.
JetStream stores these events in an append-only log with configurable retention – we keep three days of data by default. This log is durable and replayable. If a downstream consumer crashes, it can resume from where it left off. If we need to reprocess historical data, we can replay events from the log.
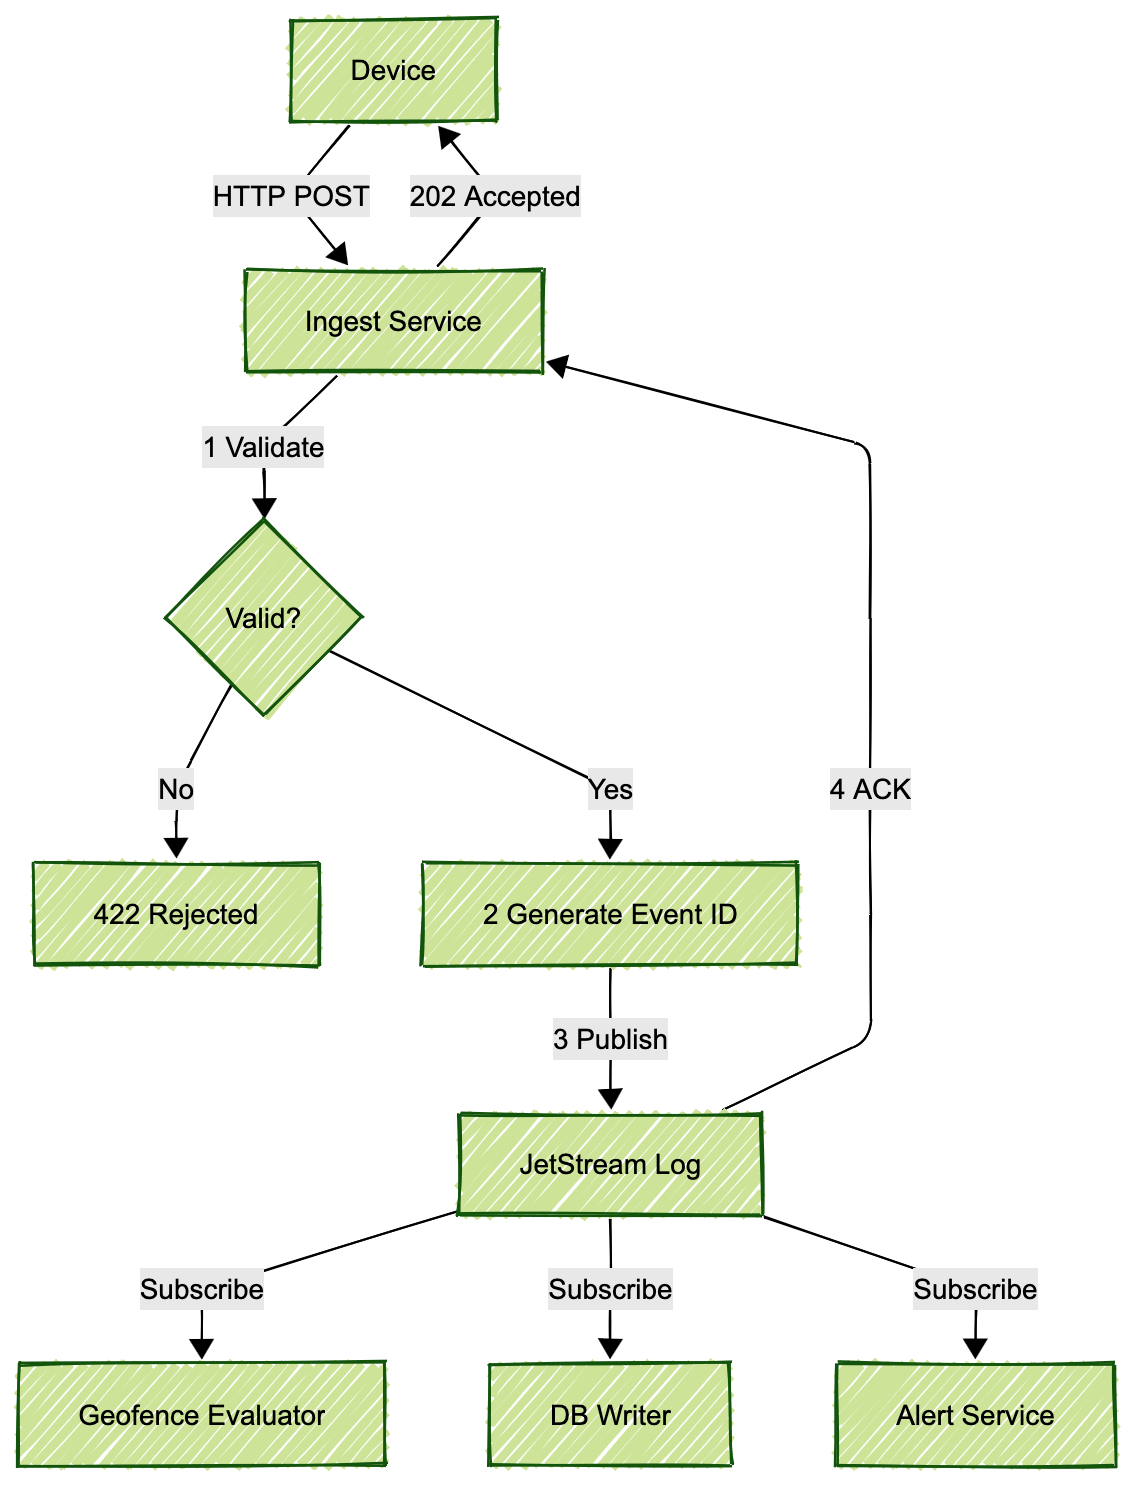
Multiple consumers can subscribe to the same stream for different purposes. One writes to Postgres, another evaluates geofence rules in real-time, another might update an in-memory cache. The ingestion service doesn’t care what happens downstream. It captured the data durably, and that’s its only job.
Why Durability Matters More Than You Think
When JetStream acknowledges an event, it has written that event to disk. If the broker crashes and restarts, the event is still there. If our Postgres database goes offline for maintenance, devices can keep sending data. Events queue up in JetStream until the database comes back.
Every telemetry update is a first-class event in an immutable log. We can replay past events to recompute outcomes, audit exactly what data we received and when, or trace any alert back to the original location update that triggered it.
Old telemetry ages out naturally within three days what is enough to recover from most operational issues and to replay recent data. Critical events like geofence entries and exits get persisted separately in a long-term events database.
The log-based approach also enables debugging that would be impossible with direct database writes. If a customer questions a reported location or missed alert, we can pull the exact event from the log and see what the system actually saw. No guessing, no reconstructing from database state.
Scaling Horizontally Without Breaking a Sweat
The ingestion service is completely stateless. We run multiple instances behind a load balancer. Each instance validates requests and publishes to the same JetStream cluster. Adding capacity means deploying more instances. No coordination needed, no shared state to worry about.
JetStream itself can be clustered for both scalability and resilience. If consumers can’t keep up with the ingest rate, messages queue in JetStream rather than backing up into the HTTP layer. The service keeps accepting data at line speed while downstream processes work through the backlog at their own pace.
We also support batching at the API level. Devices can send multiple telemetry records in a single request, either as a JSON array or newline-delimited JSON. This reduces HTTP overhead and allows downstream consumers to batch database inserts. Writing 500 records in one transaction is vastly more efficient than 500 individual inserts.
The subject naming scheme provides logical partitioning by tenant and asset. If one tenant generates extreme load, we can dedicate processing resources specifically to their feed without impacting others. Heavy tenants don’t cascade failure to everyone else because their events flow through isolated subject channels.
Making Operations Deterministic and Idempotent
We use UUIDv5 for event IDs because it’s content-addressed. The same input data always produces the same UUID. This makes the entire pipeline idempotent by design.
When publishing to JetStream, we set the Nats-Msg-Id header to the event ID. JetStream deduplicates messages with identical IDs within a configured window. If our service tries to publish the same event twice – maybe due to a network retry – the broker recognizes the duplicate and discards it.
Downstream, the event ID serves as a primary key in Postgres. If a duplicate event somehow makes it through, the database insert fails on unique constraint violation rather than creating duplicate records. The geofence evaluator uses event IDs to skip events it has already processed.
This determinism extends to testing. Our validation and normalization logic is purely functional – no I/O, no system time calls, no random UUIDs. Given the same input, you get the same output. This makes the code trivially testable without mocking frameworks or complex fixtures.
If we need to evolve the telemetry format, we’ll version the schema explicitly rather than changing what constitutes a unique event. The event ID is derived only from core identifying attributes – tenant, asset, timestamp, coordinates. Optional metadata fields don’t affect the event’s identity. This stability is crucial for maintaining idempotency over time.
Handling Failures Without Losing Data
Distributed systems fail. Networks partition, brokers get overloaded, downstream services crash. We built failure handling into every layer.
When the service publishes to JetStream, it waits for acknowledgment with a timeout. No ACK means potential failure. We retry up to three times with exponential backoff. Same event ID every time, so if the broker actually received it, deduplication prevents double insertion.
If retries fail, the event goes to a Dead Letter Queue. We maintain a separate JetStream stream specifically for events that couldn’t be published to the main stream. These DLQ events include the original payload and metadata about the failure. Operations can inspect the DLQ manually and replay events if needed.
The ingestion API still returns 202 Accepted even when events land in the DLQ, but we note the failure in the response and increment rejection counters. This alerts the client that something unusual happened without requiring them to retry and potentially create duplicates.
We also implement rate limiting per tenant using a token bucket algorithm. If a client exceeds their rate limit, we return HTTP 429 immediately. This protects the pipeline from runaway clients and provides early backpressure. Large payloads get rejected with 413 to prevent memory exhaustion.
The service’s readiness check requires JetStream connectivity. If the broker is down, we report not ready and the load balancer stops routing traffic. Better to fail fast than accept data we can’t handle.
Keeping Tenants Isolated
Every telemetry record is tagged with a tenant identifier. The NATS subject includes both tenant and asset: telemetry.v1.{tenant}.{assetHash}. This means tenant data never mixes at the message level.
Consumers can subscribe to specific tenant feeds using subject filters. We can run dedicated processing instances for high-volume tenants or assign them to separate database partitions. One tenant’s load spike doesn’t cascade to others because their event streams are logically isolated.
Events for each tenant+asset combination arrive in order. JetStream preserves publish order within a subject. This predictability matters for geofence evaluation – GPS points get processed in the sequence they were reported.
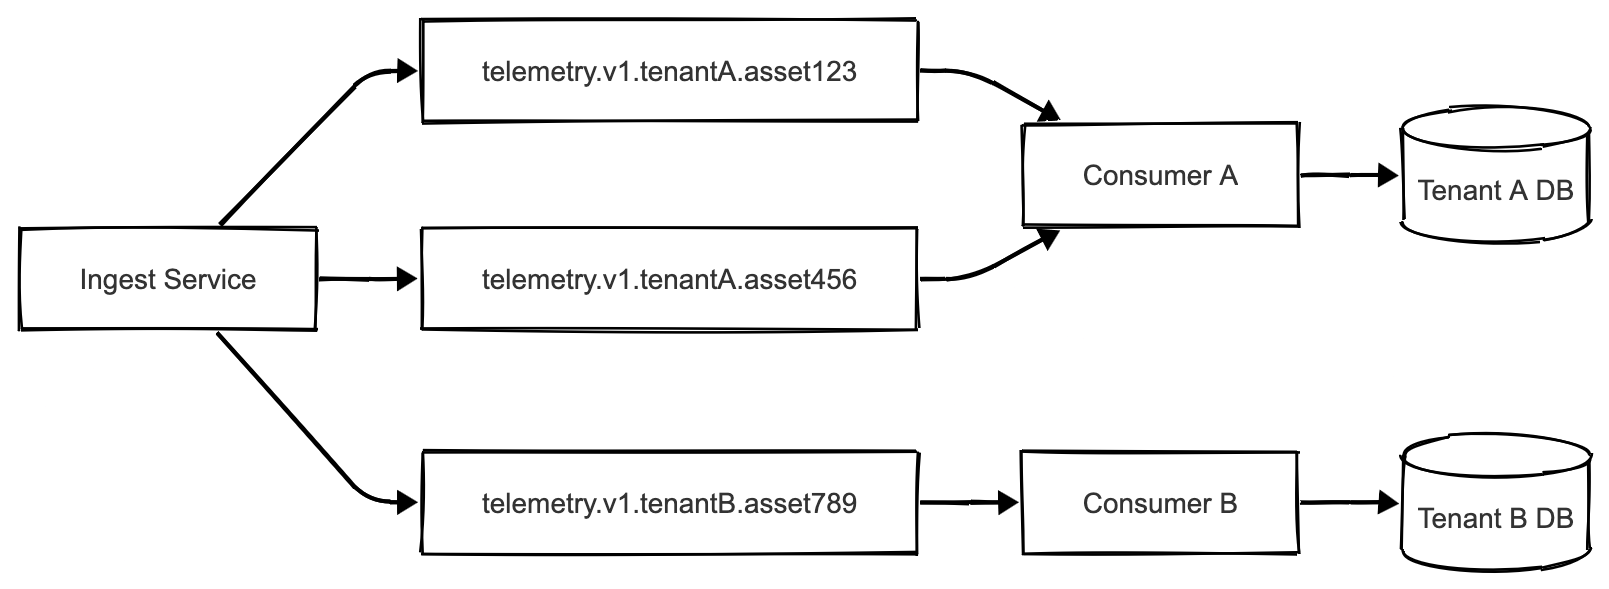
At scale, we could create separate JetStream streams per tenant for complete isolation. Currently, one stream with subject-based partitioning has been sufficient. The key is maintaining tenant boundaries from ingestion through processing so no tenant affects another’s reliability.
What We Avoided by Not Writing Directly to Postgres
Direct-to-database ingestion looks simpler but that simplicity is deceptive.
First, throughput becomes limited by database write performance. Postgres can handle many concurrent inserts, but thousands per second from distributed trackers will eventually overwhelm it. You’ll see lock contention, I/O saturation, and climbing response times.
Second, you have no backpressure handling. If the database lags or goes offline, incoming data either gets dropped or clients time out. There’s no buffer to smooth out traffic spikes or provide resilience during database maintenance.
Third, you’ve coupled ingestion latency to database operations. Clients must wait for transactions to complete and indexes to update before getting a response. With our pipeline, clients get sub-10ms responses regardless of downstream load because we’re just validating and queuing.
Fourth, error handling becomes messy. If a single record in a batch violates a constraint, do you roll back the entire batch? Do you partially commit? How do clients know which records succeeded? The pipeline handles each event individually with clear success or rejection states.
Fifth, you can’t easily add new consumers. If you want to start computing analytics or pushing updates to a cache, you’re either polling the database or adding database triggers. Both approaches are inefficient and tightly couple new features to the data model.
The event log approach trades some operational complexity for structural soundness. Yes, we run an additional service and maintain a message broker. But we gained horizontal scalability, reliable buffering, replayable history, and clean separation between ingestion and processing. Those benefits are worth the operational overhead.
Conclusion
Could you build this differently? Sure. Kafka instead of JetStream, C# instead of Rust, different subject schemes or retention policies. The specifics matter less than the architectural pattern: decouple high-speed data intake from heavy processing, buffer through a durable log, and make everything deterministic and replayable.
This isn’t over-engineering. It’s acknowledging that high-frequency telemetry systems have specific requirements that a simple REST-to-database approach can’t meet. The added complexity pays for itself in reliability, scalability, and operational flexibility.
If you’re building anything that ingests substantial event streams – IoT telemetry, application logs, financial transactions – consider this pattern. The investment in proper event handling up front saves you from painful rewrites later when your direct-to-database approach can’t keep up.
Cheers!